

Sales
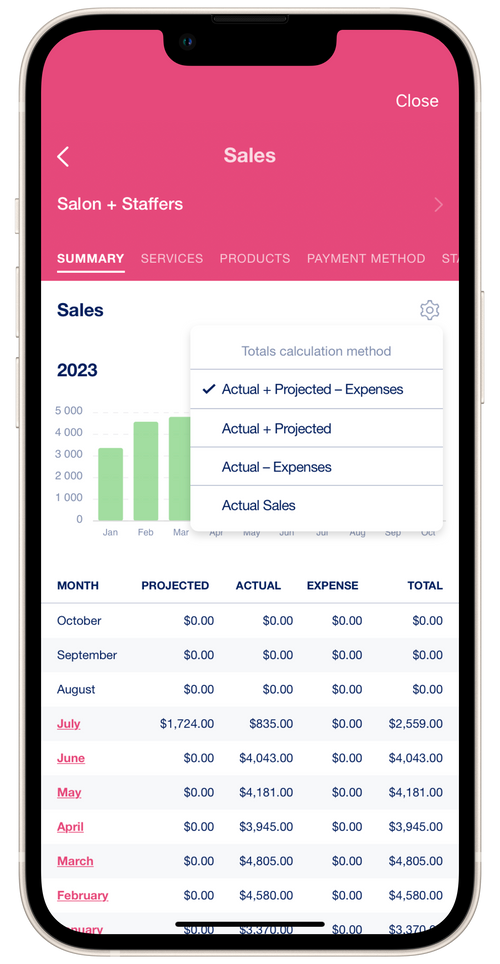
In the Sales widget on the main reporting screen, the total sales of the salon and staffers for the current month are displayed by default. You can adjust the formula for calculating the final sales by clicking on the gear icon on the right. There are four calculation options:
- Actual + Projected – Expenses
- Actual + Projected
- Actual – Expenses
- Actual Sales
Click on the Report button to open a detailed sales report. The section has a report selection menu: Summary, Services, Products, Payment Method, Staffers, Deposit, Tips. In each report of the section, graphs of the ratio of the total sales to the month/year are generated. Detailed reports for each month are divided into weeks.
💡 To view the reports, you can select the display Salon + Staffers, Salon (the name of your salon) or Staffer (the name of the staffer) at the top.
Summary
Section titled “Summary”The summary report shows the salon’s sales for each year into months.
Services and Products
Section titled “Services and Products”The services report has four modes for viewing revenue from services: all services, by services (combined), by services (single) and by service category.
- In the all services mode, the total sales from the cost of all services rendered in the salon is displayed. To view a detailed report on revenue from all services, click on the name of the month.
- In the mode by services (combined) the total sales from the services provided by the complex are displayed, i.e. several services in one appointment. In this mode, discounts that you have added to client’s appointments are taken into account. The report generates diagrams with the ratio of complex services that bring the salon the most sales.
- In the by services (single) mode, the total sales from each service are displayed separately (not in a complex). In this mode, discounts that you have added to client’s appointments are not taken into account, i.e. the cost of services that is indicated in the price list of the salon is taken into account. The report generates diagrams with the ratio of simple services that bring the most revenue to the salon.
- In the by service category mode, the total revenue from each service group is displayed. The report generates diagrams with the ratio of groups of services that bring the salon the most revenue.
There are two modes of viewing revenue from products in the products report: all products and by products.
- In the all products mode, the total sales from the cost of all products sold in the salon are displayed. To view a detailed report on revenue from all products, click on the name of the month.
- In the by products mode, the total sales from each item sold in the salon are displayed. In this report, charts are formed with the ratio of products that bring the most revenue to the salon.
💡 The charts in the reports on services and products show only three services/products that brought the most revenue to the salon for the selected period. The rest of the services/products will be displayed in the Other category.
Payment type
Section titled “Payment type”The report’s main screen displays the total revenue by payment type.
Staffers
Section titled “Staffers”The report shows the total sales for the salon, for each staffer separately and in total for the salon and staffers. The report can be viewed by year, month, week, for today or for any period.
The report generates a table based on two indicators:
- number of appointments for the selected period
- total revenue from these appointments
Click on the staffer’s name or the name of the salon to view the list of appointments of the staffer/salon for the selected period. The list shows the date and time of the appointment, the client, the service, the total revenue from the appointment and the revenue of the staffer/salon from this appointment with a percentage.
Deposit
Section titled “Deposit”The report shows the total number of appointments in which the deposit was specified, and the amount of deposits.
The report shows the total number of appointments in which tips were indicated, and the amount of tips.
💡 Data on the type of payment, deposits and tips are received in reports from client’s appointments in the salon calendar.