

Main Reporting Screen
On the main screen of the Reporting section, you can view reports on your income, clients, services and expenses. The widgets briefly present general data for each reports. Click on the widget and you will have a full view of the report.
Basic Widgets:
Section titled “Basic Widgets:”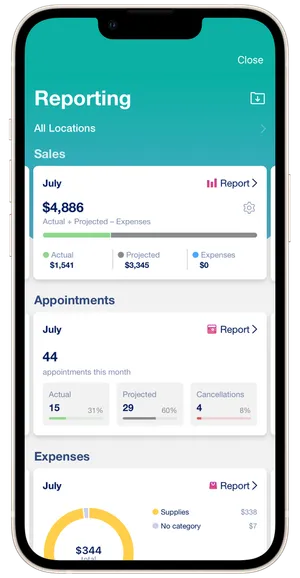
The widget displays the total sales for the current month. You can adjust the formula for calculating total sales by clicking on the gear. The widget can be scrolled to the right and left to view income for past and future periods.
Appointments
Section titled “Appointments”The widget displays the total number of appointments for the current month by category: actual, projected, cancellations. The widget can be scrolled to the right and left to view data for past and future periods.
Expenses
Section titled “Expenses”The widget displays the total amount of expenses for the month by category. The widget can be scrolled to the right and left to view expenses for past and future periods.
Clients
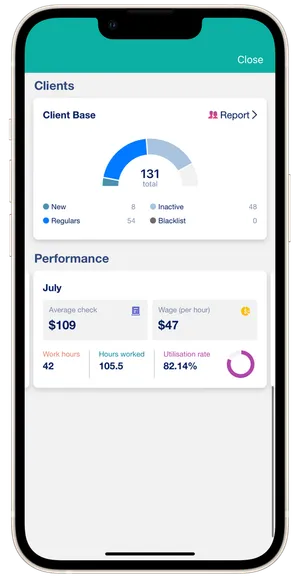
Section titled “Clients”The widget shows the total number of clients by category: new, permanent, inactive and blocked. This widget always displays the data for the current moment, so the widget doesn’t scroll.
Performance
Section titled “Performance”The widget displays the main indicators of your work efficiency. The widget can be scrolled to the right and left to view data for past and future periods.
Location selection
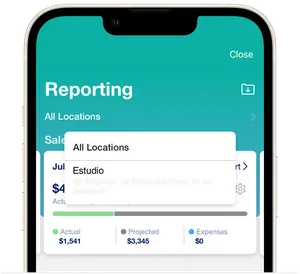
Section titled “Location selection”Reports can be viewed at once for all locations of work. If you have several locations, you can choose a specific location to view reports. To do this, click on All locations on the main screen. The choice of the location to view is applied to all reports.
Export reports
Section titled “Export reports”Click on the folder icon in the upper right corner and export reports in Excel file format. The file will be sent to the email address that you specified in your account.
💡 You can export reports only on the VIP Premium plan.
Color theme
Section titled “Color theme”The background color of the Reporting section matches the theme in the app. You can set the color theme of the app in the Settings → Dashboard Color section.